Source
https://www.qazistoolkit.com/qt-charts
Category
File Size
16 MB
Publisher
qazistoolkit
Updated
November 16, 2024
Description
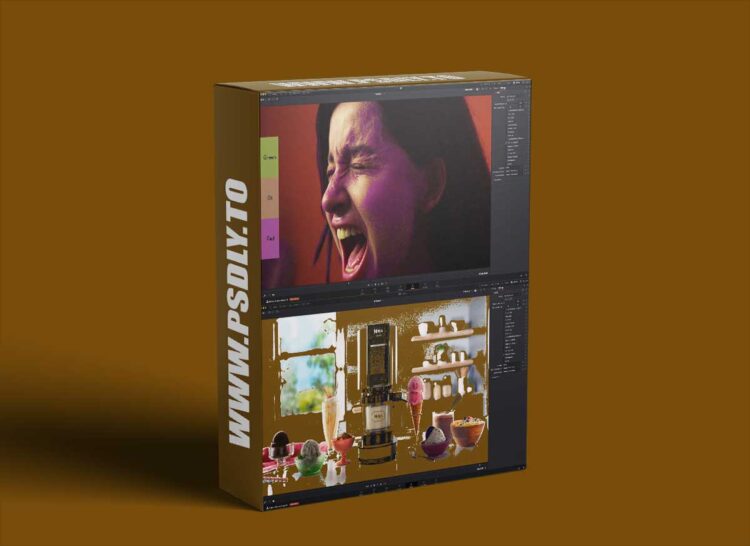
Generates a 33 point Cube LUT image. This helps you keep track in Nobe or the 3D Histogram what your overall pipeline is doing to the gamut boundaries.
Preview
1 image
Download File